PERT is a project planning model that helps you to accurately forecast how long your project will run. A PERT chart gives you a clear overview of the required time calculated for each task so you can plan your project accordingly. If you’re a project manager and want to coordinate the resources of your team for a successful project, read on. Our favorite project manager, Bert the PERT expert, explains the PERT model in simple terms.

Did you know that the name Bert means “bright,” “famous,” and “noble”? Neither did we. But we’d like to introduce you to Bert. Bert is a project manager at AllGood Ltd – and he’s famous for his hugely successful projects. “How do you do it, Bert?” he’s often asked. His answer: “With PERT. Think BERT, only with P – for productive!”. And because this response always raises some eyebrows in the office, Bert wants to take this opportunity to explain his method for success.
A PERT chart helps you easily assess and track the time and resources required to complete a project. It also allows your organization to commit to projects that are relevant to its strategic positioning. It even improves communication during the project, too.
In this 7-minute read, Bert explains how PERT can help you enhance your project planning. You’ll learn:
- What is the PERT method?
- What is a PERT chart?
- How do PERT charts improve your projects?
- When should you use a PERT chart?
- How to create a PERT chart and integrate it into your project.
- How does a PERT chart differ from a GANTT chart and CPM chart?
Take a look at our other project planning tips – including how to create a project timeline, and how to improve your project resource planning.
What Is the PERT Model?

The PERT model is a visual project planning method. PERT in project management stands for Program Evaluation Review Technique. PERT helps you to plan the average duration of certain tasks over the course of the project. This allows you to better estimate the expected overall project timeline and cost.
PERT was developed by the US Navy in 1958 to simplify the planning of the complex Polaris missile submarine project. The research and production of new components for the submarine were distributed to various contractors. It wasn’t possible to calculate the exact time and effort required for the individual steps, which is why the contractors were asked to provide an estimate of the possible duration.
The PERT model helped shorten the development time of the Polaris project by two years!
At the same time, the private sector developed the critical path method (CPM). This method is similar to PERT. Both visually represent the project timeline. The only difference is that the CPM works with the longest estimated task duration of project tasks. PERT, on the other hand, works with 3 different task duration estimates:
- The shortest duration (optimistic value): You schedule the tasks without accounting for risk, assuming the lowest time requirement or cost.
- The longest duration (pessimistic value): You schedule tasks accounting for the highest risk, assuming the highest time requirement or cost.
- The most probable duration (expected value): You factor in minimal risks and plan for some changes and delays to project tasks.
PERT is, therefore, a more differentiated approach than the critical path method.
The PERT model is ‘old but gold’. Although it was developed in the 1950s, it’s still used today by project managers around the world to simplify projects.
The PERT model was also used in the organization of the 1968 Grenoble Winter Olympics. Although numerous similar management concepts have been devised and developed since then, PERT was the first technique of its kind – and it’s still popular today.
What Is a PERT Chart?
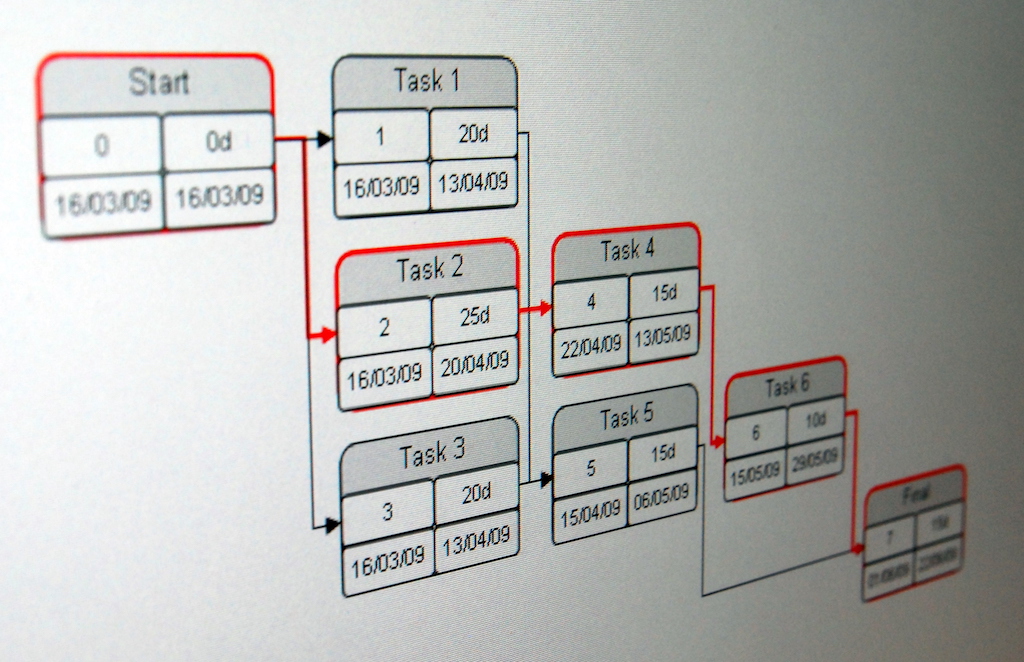
A PERT chart is the practical application of the PERT model. It helps you to visualize the planned tasks of a project and their dependencies. For example, it’s useful if you want to share an initial timeline and a projected schedule with stakeholders before the project launch.
I create a PERT chart using the template in MindMeister. I then link to the mind map in a large project overview task in MeisterTask. This way, everyone in my project team always has access to the information they need.
Tailor this PERT chart template to your project and link out to it from your MeisterTask overview task.

How Do PERT Charts Improve Your Projects?

As a project manager, a PERT chart helps you to visually plan a project in a structured way – and execute it methodically. Use a PERT chart to easily evaluate the schedule, the necessary resources and the critical path of your project. Doing so will…
- Improve your time management. A PERT chart highlights both the individual task duration and the overall project duration. It’s a great method to define the expected schedule in detail during the project planning phase.
- Improve your resource management. With a PERT chart, you can easily see which tasks require which resources. This saves you and everyone involved in the project time, as everyone can easily access the information independently.
- Improve your project overview. One of the key features of a PERT chart that sets it apart from other methods is its ability to determine the critical path of a project. The critical path method is important if you want to visualize the schedule of your project with all of its task dependencies and uncertainties.
PERT charts improve accountability because my project team has a full overview of roles, responsibilities and timelines. I also often complete projects ahead of schedule because everyone on the team knows exactly what they are supposed to do and when. I can avoid delays as expectations are clear.
When Should You Use a PERT Chart?

As mentioned above, PERT was developed for planning extremely complex projects. In other words, projects in which you and your team must coordinate and work through many parallel and consecutive tasks.
If your project requires allocating multiple tasks to various team members, a PERT chart can help. This practical template provides a robust framework that can serve as a basis for further steps.
However, to implement the PERT model, you also need reliably observed data from the past or clear expert estimates of future expectations. If you do not have this data, the results will not be accurate or helpful.
If you’re dealing with a fairly straightforward project, introducing the PERT model will only cause confusion. Valuable time will be wasted on estimations, which are unnecessary due to the lack of detail in the project. Note that there are disadvantages to PERT charts, including:
- Calculating PERT and creating a chart is time-consuming. Once you start subdividing all the necessary tasks, the number of tasks to manage can quickly become overwhelming.
- You need to create a PERT chart before the launch of your project for the administrative effort to be worth it.
- If the optimistic and pessimistic estimates deviate greatly from the probable value, you’ll end up with a distorted result, which can ultimately lead to bad decisions.
- It’s difficult to give a concrete indication of the project duration, even with expert input.
- Diagrams such as PERT charts help illustrate expectations – but not the project status.
- Expectations are not necessarily met during the course of the project, which can quickly make your PERT chart redundant.
If you decide to work with a PERT chart, it’s best to link it in your task management tool. This way, you create a higher level of accountability by providing a clear overview of roles and responsibilities in the main project task. When your team can easily access overall expectations and the current project status in one place, you empower them to reach project milestones on time.
How to Create a PERT Chart And Integrate It Into Your Project.

To create a PERT chart and integrate it into your project seamlessly, complete the following 6 steps in order:
1. Identify All Project Tasks
To create a successful PERT chart, start by identifying and collecting all project information and tasks. Use either a mind map or a note in your task management tool. Whichever you choose, share it with your team and work on it collaboratively to quickly gather more insights. More eyes on it means less chance anything will be forgotten.
To give your team an easily accessible overview, link this “list” of project tasks to the actual tasks in MeisterTask once you create them.
2. Define All Task Dependencies
You should now identify all tasks that rely on the completion of another task in order to be worked on.
Identifying all task dependencies will help you to:
- Allocate tasks appropriately and follow up on them later.
- Ensure the timely completion of tasks.
- Make clear what needs to be communicated, when and to whom.
To make task dependencies clear from the start, I add connecting arrows between individual tasks in my mind map from step one.
3. Open Your PERT Chart Template
The best way to create a PERT chart is to open the MindMeister template (shown under “What is a PERT chart?”) and transfer the final tasks and dependencies from the above steps in a logical sequence. To make this easier, number the tasks and add the responsible person to your list before you transfer the information over.
4. Estimate the Duration of Each Project Task
Now it’s time to plan your project timeline by applying thePERT formula to each of your tasks:
PERT value = ((optimistic value + (4 times expected value) + pessimistic value)) / 6
This calculation relies on previous experience and data. It helps you to communicate with your project team – in the best case directly in your MeisterTask tasks – how long a task will realistically take.
You use the formula to calculate the average value from the three estimated values for each task, with the most probable case being weighted by a factor of 4. This results in the planned value, also known as the PERT value.
Now transfer the PERT values to all your tasks in your mind map.
With PERT, you usually calculate back from a fixed end date rather than the other way around, as contractor deadlines often cannot be moved.
PERT Example: Calculation Using the PERT Formula
Let’s assume that the marketing team at AllGood GmbH needs a visualization of the collected campaign data.
The team knows from experience that under optimal conditions, when all the information is available, they need 300 minutes to do this. Under normal conditions, when only individual pieces of information need to be researched, it takes 450 minutes. Under unfavorable conditions, when missing documents have to be requested, 600 minutes. The planned values are calculated using the PERT formula as follows:
Planned value = (300 + (4 x 450) + 600) / 6 = 2700 / 6 = 450 minutes = 7.5 hours
5. Create All Tasks in Your Task Management Tool
Create all the main or “parent tasks” for your project in your task management tool. Define the person responsible for the task, add all project participants as watchers, and link out to your project overview note and PERT diagram.
It’s likely your task requires contributions from multiple team members. To provide more clarity as to what needs to be done and when, break down your high level tasks into subtasks. Assign them to the responsible person with the required due date. However, Keep discussions to the parent task. This will ensure that your team uses this project task as the single source of truth for the project – and don’t miss any updates.
6. Coordinate Your Project Workflows
Now all that remains is to coordinate the delivery of the tasks until the project is complete. By centralizing all your communication in your parent project task – where you can also access the linked PERT diagram at any time – you and your team can easily track the progress of each task and communicate updates.
Remember to update your PERT chart throughout the project as changes occur.
How Does a PERT Chart Differ From a GANTT Chart and CPM Chart?

All three charts have a common purpose: to improve project planning. But there are a few key differences between them.
PERT Chart vs. Gantt Chart
PERT and Gantt charts are often conflated, but there are important differences between them. Not only do they differ visually, but they also offer different functions to suit different needs.
- PERT charts are flowcharts, Gannt charts are bar charts. The former are less structured in their appearance and the layout can be slightly different depending on the project.
- Gantt charts score points for their organization, PERT charts for their customizability. Gantt charts offer an organized structure while PERT charts allow for easy layout customization, which is better suited for presenting top level project plans.
- PERT charts are best used before the project begins. With their simple timeline-friendly layout, PERT charts are often used as visual aids during a project kick-off. Project managers then like to use other methods, such as a work breakdown structure, a GANTT diagram or a Kanban board, to specifically assign project tasks and highlight dependencies.
Ultimately, GANTT charts are best suited for mapping project tasks throughout the project cycle, while PERT charts are best used for planning and scheduling in the initial project phase. The charts can be used separately or together to create a comprehensive project plan.
PERT Chart vs. CPM Chart
Both charts, i.e. PERT and CPM charts are models for project planning and management. They’re used to efficiently plan and organize task sequences for larger projects.
The main difference is that project managers like to use PERT charts to determine how much time will be required to complete a project, while they use CPM charts to control costs and time spent.
For optimal results, you can use CPM charts in parallel with PERT charts. By integrating both methods into your project management strategy, you can give your team a realistic deadline and provide the optimal workflow for your project.
Get Productive With PERT.
Sounds interesting? Then give it a try. Your PERT template is waiting for you! For further suggestions and tips on project planning, check out the Meister Community.
I wish you every success with your first PERT chart!
FAQs
What is a PERT chart?
A PERT chart shows you the planned tasks of a project and their dependencies visually.
How do PERT charts improve your projects?
As a project manager, a PERT chart helps you to visually plan a project in a structured way and complete it quickly. With such a diagram, you can easily evaluate the schedule, the necessary resources and the critical path of your project.
How do you create a PERT chart and integrate it into your project?
To create a PERT chart and integrate it into your project efficiently and clearly, complete the following 6 steps:
- Identify all project tasks.
- Define all task dependencies.
- Open your PERT template.
- Estimate the duration of each project task.
- Create all tasks in your task management tool.
- Coordinate task progress.