How our free Gantt chart template helps you
Gantt charts show how project tasks relate to each other. This helps you estimate the overall project duration and respond quickly when timelines shift. With Gantt charts, you can:
Manage your team’s time and responsibilities
Assign the resources needed to complete tasks
Keep budgets on track
Spot schedule delays with real-time updates
Because everything is laid out clearly, your team can understand the full scope of requirements and dependencies. So you can:
Prioritize the most important tasks in your plan
Coordinate with teammates on dependent work
Find ways to run the project more efficiently
MeisterTask’s Gantt template gives you more control
When you update your Gantt chart in MeisterTask, you don’t need to share updated files or send emails to communicate changes. Instead, your team can see everything in one centralized platform. It's much simpler than trying to manage everything in Excel or similar tools.
Dependencies and date changes are visible right away. Updates happen in the context of each task. There’s less coordination, less overhead, more visibility.
What is the Gantt chart template for?
The Gantt chart template gives you a quick overview of your plan, milestones and dependencies. It helps you:
Map project requirements clearly
Define milestones and timeframes
Visualize tasks and dependencies for resource planning
So it'll be easier to build a solid project plan, share progress easily and keep stakeholders informed about timelines and deliverables.
How to use the Gantt chart template
The Gantt chart template is one of the best resources you can use for project management. By segmenting project milestones into organized sections, you can list out all the tasks that must be completed to achieve your project goal.
Once you’ve listed out your tasks, you can use the template’s built-in drag-and-drop features to assign tasks to your Gantt chart timeline and build out a full working schedule. The horizontal timeline tracker makes it easy to monitor status updates, address any roadblocks, reassign resources, and manage competing priorities.
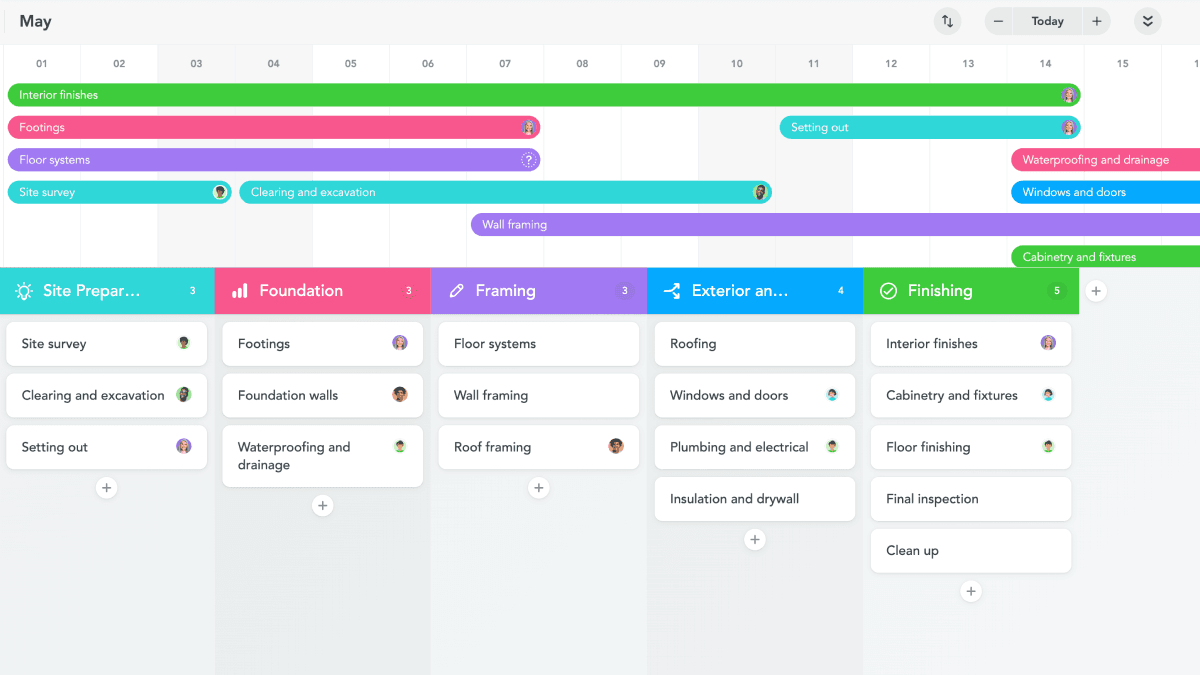
Step 1: Organize your project into sectional milestones
Begin by creating vertical sections in your template to map out the milestones in your project. If you’re building a house, what are the stages of construction that must be completed before you can move onto the next phase of the project? Use the template’s sections to list out all phases of the project.
You can name each section using whatever label best suits your unique project needs. However, keep in mind that the purpose of the template is to build an effective Gantt chart. The timeline should be clear and specific to any stakeholder who views the project status updates.

Step 2: Break down the project into various tasks
Now you’re ready to break down the project into tasks. You can create a new task by clicking the + in any section of your project board. Be sure to add a detailed description of the expectations and assign a tag so that the assignee understands the task scope.
As you list out your tasks, keep in mind any tasks that will be dependent on other tasks being completed first. Your final Gantt chart template should provide a smooth, ordered project timeline that shows how each task will be completed, and when. If certain tasks have other dependencies, make a note of that on your project board.

Step 3: Assign people complete the tasks
Once you’ve listed out your tasks and organized them based on project dependencies, you’re ready to assign specific tasks to your team members. The template supports relative work estimation techniques so that you can tag each task as a small, medium, or large deliverable. Use the relative work estimation to start visualizing how task dependencies will intersect with each other throughout the project.

Step 4: Create your Gantt chart timeline
Now, you’re ready to use one of the biggest features of the Gantt chart template: the Gantt chart project timeline. Click the “Show project timeline” option at the top of your project board to activate the Gantt chart feature.
You can drag each of your tasks from your project board onto the project timeline and build your horizontal Gantt chart. Once you drop a task onto the project timeline, click and drag the task horizontally to assign the appropriate start and end dates. This will create a visual overview of all tasks and project dependencies, creating a more complete picture of the project timeline.

Step 5: Monitor status updates and task dependencies
As tasks are completed and the project moves further along in the project timeline, you can monitor task completion milestones and team performance with your template. Use the Reports feature of your Gantt chart template to generate status and bandwidth updates. You’ll receive a brief summary on how team members are performing and the efficiency to which resources are being used. Make any changes to your project plan based on what the Reports feature generates.
Level up your Gantt chart with MeisterTask
Our Gantt chart template is a great starting point for project planning.
As your project grows and you’re managing more dependencies, teams, or changes, advanced features help you plan and stay on track more efficiently—with less manual upkeep and more transparency:
Real-time updates instead of manual maintenance. Status and progress stay up to date automatically.
Dependencies and date changes at a glance. Shifts become visible immediately.
Collaboration in context. Comments, files and decisions live directly in tasks.
Automations for repeatable workflows. Less busywork, more focus on delivery.
Filters, tags, and views. Quickly sort by owner or status.
This turns a simple Gantt chart into a scalable system you can rely on, no matter how complex the project.


